Zoho Analytics on Zoho CRM data: the short answer
Zoho Analytics on Zoho CRM data: a first dashboard needs three things: an administrator to connect the two apps, a plan whose sync interval fits how often your managers look, and a data check before anyone draws a chart. With those in place, a first sales dashboard can show pipeline by stage, won revenue by month and activities per owner.
This guide is the first of three posts on Zoho Analytics. It covers getting started, from the connection to a first dashboard a manager opens every week. The other two posts go further into the product once you have this foundation running.
The order matters. Most dashboards that nobody uses fail before the first chart, because the CRM fields behind them were never checked. So this guide covers the connector and the plans first, then the modelling checks, and only then the dashboard itself.
Every limit and figure below comes from Zoho's own pages: the Zoho Analytics pricing pages, the Zoho CRM connector help and Zoho's data centre page. Where two of those pages disagree, the guide says so and gives you the more cautious figure to plan on.
What the Zoho CRM connector for Zoho Analytics is, and who can set it up
The Zoho CRM connector is the built-in integration that copies your CRM data into Zoho Analytics on a schedule, so you can build reports on it. Zoho calls the result Advanced Analytics for Zoho CRM. According to the Zoho CRM connector help for Zoho Analytics, it includes more than 100 prebuilt reports and dashboards over your CRM data. Zoho CRM's own help gives a lower count, so treat the prebuilt set as a useful starting point rather than a fixed number.
Only an administrator can configure the connector. Zoho's help names two roles: Account admin and Org admin. If you are a sales manager without either role, you will need your Zoho administrator for the setup step.
Terms you will meet in this guide
- Report: Zoho's collective term for a chart, pivot table, tabular view or summary view.
- Workspace: the container in Zoho Analytics that holds your imported tables, reports and dashboards.
- Lookup relationship: a link between two tables on a common column, such as Customer ID or Email, used to blend data.
- Query Table: a Zoho Analytics feature that combines data from different tables into one table you can report on.
The connector also creates lookup relationships for you. Zoho Analytics links Zoho CRM automatically with Zoho Books, Zoho Desk, Zoho Campaigns, Zoho Inventory, Zoho Subscriptions and Zoho Invoice. For most other applications you create lookups by hand.
Which Zoho Analytics plan you need for Zoho CRM data
For a first sales dashboard, the Basic plan is the practical entry point, and Standard is the step up when daily data is too slow. The Free plan gives you 2 users and 10,000 rows, which is enough to explore but small for real CRM history. Every plan includes unlimited reports and dashboards, so the limits that bite are users, rows and refresh rate.
| Plan | Users (from) | Rows (from) | Refreshes a day (pricing page) | CRM sync (connector help) |
|---|---|---|---|---|
| Free | 2 | 10K | 1 | Not listed |
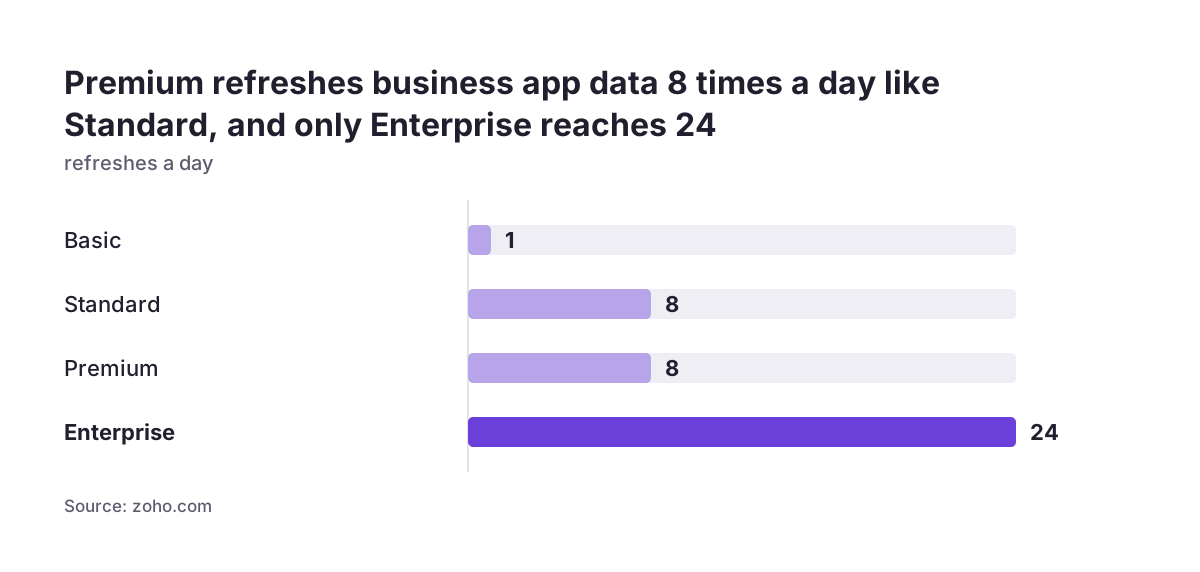
| Basic | 2 | 0.5M | 1 | Daily |
| Standard | 5 | 1M | 8 | Every 3, 6 or 12 hours |
| Premium | 15 | 5M | 8 | Hourly |
| Enterprise | 50 | 50M | 24 | Real time |
Rows are counted across your whole account. The Zoho Analytics pricing page defines the limit as the sum of all rows in all tables in all workspaces. Activity tables such as calls and tasks usually grow fastest, so check their size before you import years of history.
The pricing page shows prices in your currency; we read it on 28 September 2026. Local taxes such as VAT come on top, yearly billing saves 20%, and the service runs month to month, so you can upgrade, downgrade or cancel at any time. A 15-day free trial needs no credit card.
Sync frequency: the two Zoho pages disagree, so plan on the lower figure
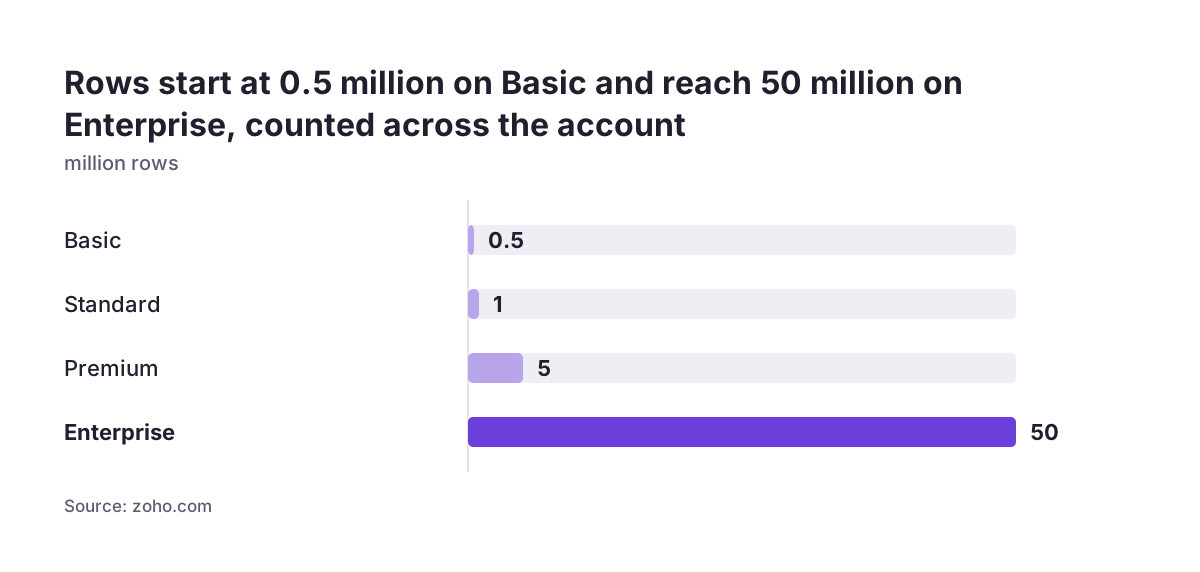
Zoho publishes two different answers on how often Zoho CRM data refreshes in Zoho Analytics, and you should plan on the lower one. The connector help and the pricing pages agree on Basic and Standard. They differ on Premium and Enterprise.
The connector help lists these sync intervals:
- Daily on Basic and above.
- Every 3, 6 or 12 hours on Standard and above.
- Every hour on Premium and above.
- Real time on Enterprise only.
The Zoho Analytics plan comparison gives refresh rates from business apps as 1 a day on Basic, 8 a day on Standard, 8 a day on Premium and 24 a day on Enterprise. Hourly sync would mean 24 refreshes a day, not 8. Real time is more than 24 a day.
So on Premium, assume 8 refreshes a day until Zoho confirms hourly sync on your account. On Enterprise, assume 24 a day. For most first dashboards this is not a problem. A weekly pipeline review works well on daily data, and a sales team that checks numbers during the day is usually well served by the Standard plan's 3-hour interval.
Put the sync interval in the dashboard itself. A manager who knows the numbers are from this morning reads them differently from one who assumes they are live.
Modelling checks to make before you draw a chart
A data model is the set of tables, fields and relationships your reports read from, and it decides whether a dashboard can be trusted. The connector copies whatever your CRM holds, including empty fields, retired stages and duplicate records. A chart built on those shows the mess, only faster.
At Svennis we write down, before any chart is drawn, the one question each report answers and the exact CRM field that supplies it. When that step is skipped, we see managers stop trusting the dashboard and go back to exporting spreadsheets.
| Check | Why it matters | What to do |
|---|---|---|
| Deal stages | Pipeline by stage is only as good as the stage list | Merge or retire old stages in CRM first |
| Amount and closing date | Revenue by month needs both on every won deal | Make both mandatory on won deals |
| Record owner | Activities per owner breaks if owners have left | Reassign records from former staff |
| Field types | Changing a field's data type in CRM pauses the sync | Agree field types before connecting |
| Modules and fields to import | Every row counts toward your plan limit | Import only what the first reports need |
If your CRM data came across from another system, the stage and owner checks are where problems usually sit. Our guide on how to migrate to Zoho CRM and keep your sales history covers cleaning that history. Fix issues in Zoho CRM, not in Zoho Analytics, so the CRM and the dashboard agree.
Connecting Zoho CRM to Zoho Analytics, step by step
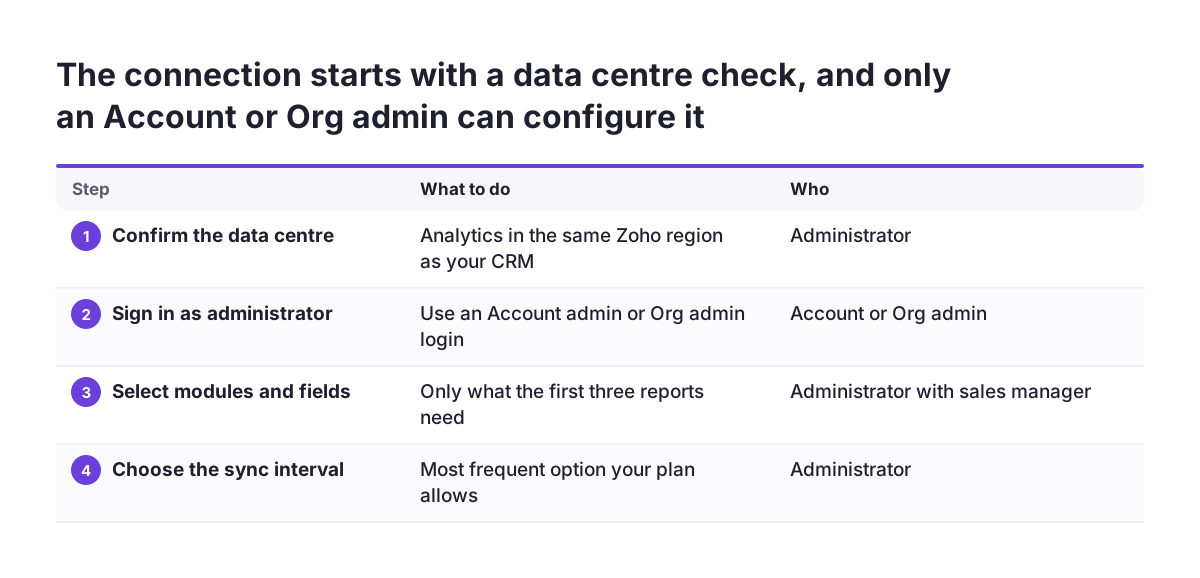
Connecting Zoho CRM to Zoho Analytics takes an administrator, a short list of modules and fields, and a chosen sync interval. The steps below follow the order Zoho's connector help describes.
- Confirm the data centre. Make sure the Zoho Analytics account sits in the same Zoho data centre as your CRM. The EU section of this guide explains how Zoho assigns it.
- Sign in as an administrator. Use an Account admin or Org admin login, because only those roles can configure the integration.
- Select modules and fields. Pick only the modules and fields your first reports need, based on the modelling checks. You can add more later.
- Choose the sync interval. Pick the most frequent option your plan allows that your managers genuinely need.
- Wait for the first import. Let the first sync finish before you judge the data.
- Open the prebuilt reports. Compare a few totals with the same view in Zoho CRM. If the deal count or won amount differs, find out why before you build anything.
The configuring user matters beyond setup day. Zoho's help says sync fails if that user loses permission to access the selected modules. Use an administrator account that will not be deactivated when someone leaves the company.
If your team runs Bigin rather than Zoho CRM, note that Zoho lists Bigin as a separate sales connector. Our comparison of Zoho Bigin and Zoho CRM helps if you are still deciding between the two.
A worked example: a first sales dashboard with three reports
A first sales dashboard should answer three questions a sales manager asks every week: what is in the pipeline, what did we win, and who is doing the work. Zoho Analytics offers more than 80 visualisation options, but three well-chosen reports beat a wall of charts.
Report 1: pipeline by stage
Build a bar chart on the deals table. Put the stage on one axis and the sum of the amount on the other, and filter out won and lost deals. This shows where open value sits and where deals stall.
Report 2: won revenue by month
Build a line or column chart on the same deals table. Filter to won deals, group the closing date by month and sum the amount. This report depends on the closing date check from the modelling table, because a won deal without a closing date drops out.
Report 3: activities per owner
Calls, meetings and tasks usually sit in separate tables. Use a Query Table to combine them into one table of activities, then chart the count per owner per week. The Basic plan allows 25 Query Tables, so one here costs little.
Finish the dashboard
Add the Data Source Permalink to the dashboard. Zoho's help describes it as a link showing whether the last sync succeeded and when the next one is due. Then decide how the manager gets access: a User can connect data and create and share reports, while a Viewer can only view, interact with and explore what is shared.
What to leave out of a first Zoho Analytics dashboard
A first Zoho Analytics dashboard earns trust by being small, so several useful features are better left for a second round. Each one adds data, cost or complexity before your team has shown it will use the basics.
These are the items we suggest you postpone:
- Blending in other apps. Lookups to Zoho Books or Zoho Desk are created automatically, but invoices and tickets add rows and questions. Add them once the sales view is stable.
- Data alerts. Alerts start on the Standard plan, with 10 active alerts, rising to 30 on Premium and 100 on Enterprise. Agree what counts as normal before you alert on exceptions.
- Ask Zia. The Ask Zia AI agent, with diagnostic insights and smart recommendations, is available only on Premium and Enterprise. Our overview of AI for reporting explains where that kind of assistant helps once reports are trusted.
- Code Studio and AutoML. Both are Enterprise-only and belong to a later, more technical phase.
- Years of activity history. Import the period your managers actually compare, and extend it once you know your row usage.
The prebuilt reports remain available throughout. Use them to answer one-off questions instead of adding charts to the dashboard your managers open every week.
Keeping the Zoho CRM sync healthy: failures, history and removal
A Zoho CRM sync into Zoho Analytics keeps running until something in the CRM changes underneath it. Zoho's connector help names three causes of failure:
- The data type of a selected field is changed in Zoho CRM.
- Modules or fields selected for analysis are deleted in Zoho CRM.
- The user who configured the integration loses permission to access the modules.
When any of these happens, the sync pauses. Zoho notifies you by email and in-app notification with the exact reason. Make sure those emails reach someone who will act on them, not a shared inbox nobody reads.
Two logs help you investigate. The Sync History tab shows sync details for the last 45 days. The Audit History dialog shows activities for the last 180 days. Check them after any CRM change to fields or permissions.
Be careful with one action in particular. Removing the data source stops all further synchronisation and deletes every associated table, report and dashboard in the workspace. If you want to change what you import, edit the modules and fields instead. Before anyone removes a data source, agree which dashboards will disappear with it.
Zoho offers technical support 24 hours a day, Monday to Friday, for connector problems. The support services available vary by plan.
Zoho Analytics for a company in the EU: data centre and GDPR
For a company in the EU, the key question is which Zoho data centre holds your Zoho Analytics account. Zoho's data centre overview lists Amsterdam in the Netherlands as the primary European data centre and Dublin in Ireland as the secondary one.
Zoho assigns the data centre from the country you choose at sign-up. That country field is pre-selected from your IP address. A colleague who signs up while travelling outside Europe could therefore land on another region without noticing. Check the country before you confirm, and make sure Zoho CRM and Zoho Analytics use the same region, so the connector works within one data centre.
Connecting Analytics also means your CRM's personal data now lives in a second Zoho application. Record that in your GDPR documentation, alongside the CRM itself. Importing only the fields your reports need keeps the copy smaller and easier to explain.
You can also avoid giving everyone a separate Analytics login. Zoho Analytics reports and dashboards can be embedded in Zoho CRM as a Web Tab, although only CRM administrators can set this up. Our page on Zoho CRM implementation in Europe covers the wider setup for companies working across several EU countries.
Next steps for your first Zoho Analytics dashboard
Your first Zoho Analytics dashboard is one working week of focused effort away if you follow the order in this guide. These are the steps to take now:
- Start the 15-day free trial on the plan you expect to buy, so you test the right sync interval and row limit.
- Run the modelling checks in Zoho CRM: stages, amounts, closing dates, owners and field types.
- Have an administrator connect Zoho CRM with only the modules and fields your three reports need.
- Compare the prebuilt reports against Zoho CRM totals before you build your own.
- Build pipeline by stage, won revenue by month and activities per owner, then add the Data Source Permalink.
- Show the dashboard to one manager for two weekly reviews, and change what they do not use.
Once that manager opens the dashboard without being reminded, you have a foundation for the next two posts in this series. If you would rather have the modelling and first dashboard set up with you, see our page on Zoho Analytics implementation and consulting.